1. FÁZIS
Agricultural DROUGHT KÉZDI_Adapt
Agricultural DROUGHT Hazard Assessment
During Phase 1 of the project in the Agricultural Drought workflow we focused on analysing yield loss percentage reduction in case of maize, wheat, potato, and rapeseed plants which are intensively cultivated on agricultural land in Targu Secuiesc and Covasna County.
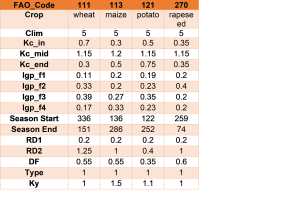
Crop specific parameters needed for hazard assessment were imported from the crop table preselected for sub continental climate zone no. 5.
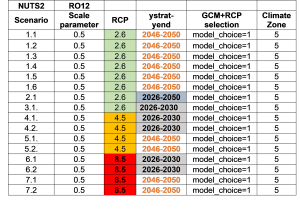
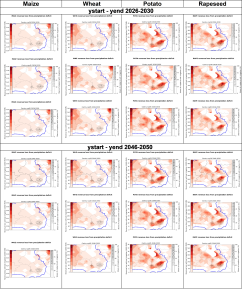
Different types of scenarios were analysed, simulations were run for different start and end year periods, near future 2026-2030 and mid-century 2046-2050, also three different RCP scenarios of the defined periods were modelled.
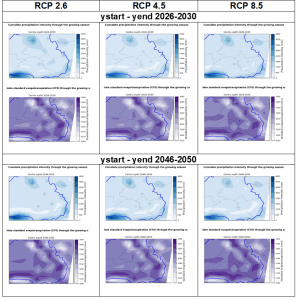
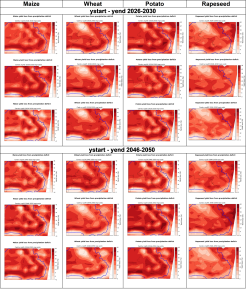
Generated precipitation and yield loss data plots are presented in tables 3 and 4.
Agricultural DROUGHT Risk assessment
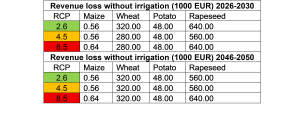
The figures presented in Table 6 show the potential revenue losses from irrigation deficit in NUTS2 Centru region, Romania with a bbox zooming on the east part of the region, for the selected crops (maize, wheat, potato and rapeseed), emission scenarios (RCP2.6, 4.5 and 8.5) and periods (2026-2030 and 2046-2050). Losses are expressed by the red shading and represent the ‘lost opportunity cost’ in thousands of euros if crops are grown under non-irrigated conditions. The hatches show the share of cropland in each grid-point with irrigation systems already implemented in 2010 and serves as an indicator of vulnerability to rainfall scarcity.
Preliminary Key Risk Assessment Findings Agricultural Drought
Severity
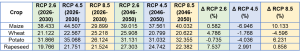
- Maize: Under RCP 2.6, yield loss slightly increases (+0.582%), under RCP 4.5, yield loss drops significantly (-6.946%), in case of RCP 8.5, yield loss increases dramatically (+10.133%), showing maize is highly vulnerable to extreme climate change;
- Wheat: Yield loss increases significantly under RCP 2.6 (+4.786%), yield loss reduces slightly under RCP 4.5 (-1.768%) and under RCP 8.5, wheat yield loss decreases (-4.596%);
- Potato: Under RCP 2.6 and 4.5, yield loss decreases slightly (-0.735% and -4.036%) and under RCP 8.5, yield loss increases by +6.231%, indicating more sensitivity to RCP 8.5 extreme warming;
- Rapeseed: Shows the biggest increase for mid-century in yield loss under RCP 2.6 (+7.537%), under RCP 4.5 and 8.5 show small increases (+2.991% and +0.858%);
- Maize: Revenue loss remains constant at 0.56 (RCP 2.6 & 4.5) but increases to 0.64 under RCP 8.5 in both periods it shows sensitivity higher representative concentration pathways
- Wheat: Loss is higher (320,000 EUR) in 2046-2050 across all RCPs, whereas in 2026-2030, it was lower (280,000 EUR) under RCP 4.5 and 8.5;
- Potato: Loss remains unchanged at 48,000 EUR across all RCPs and both time intervals, indicating resilience making it the least financially impacted crop;
- Rapeseed: In 2026-2030, loss is lowest under RCP 4.5 (560,000 EUR) but increases under RCP 2.6 and 8.5 (640,000 EUR). In 2046-2050, loss increases to 640,000 EUR under RCP 8.5 and stabilizes at 560,000 EUR for RCP 2.6 and 4.5.
Urgency
In the case of Agricultural Drought, immediate actions have to be made, highlighting the importance of implementing irrigation systems but applying sustainable water management principles in this case productive and financial sustainable agriculture sector can be maintained.
River Flooding KÉZDI_Adapt
River Flooding Hazard assessment
In the first phase of the project we focus on analysing river flood risks, considering the geographic properties of the city and the surrounding places. The city of Targu Secuiesc lies between 3 rivers which have 2 merging points, one at the north border and the other on the south border of the city. These circumstances are significant concerns for us if there is a major rainfall on the water catchment basins. Our analysis assesses the potential impacts and outcomes of the potential floods. This vulnerability shows us the importance of understanding and managing the risks associated with river flooding. Projections from the CLIMAAX toolbox highlight the flood risks and the potential damage zones in Targu Secuiesc.
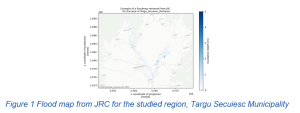
The Europe-wide dataset of river floods provides a consistent overview of river flood hazard for all regions, but it has several important limitations. The dataset only includes large river basins (larger than 150km2) and does not include flood protections, which can lead to unrealistic flood maps in some regions. In addition, the underlying river model does not include any water management. This is why we could not get any valuable result on some maps. Here we can see the possible flooded territories of the Casin river at the left side and the Raul Negru at the right side.
River Flooding Risk assessment
Flooding is a significant risk in Targu Secuiesc, although the last flood was in 2018, the possibility exists every year when the rainy season comes. Usually, we have up to one month in the spring and one in the summer when rains are coming regularly. In 2018 the Ruseni part of the city was affected, although the water retracted after 6-8 hours, the damage was done. The damage included farmland, basements of houses, roads, and gardens.
In the first phase we conducted the analysis using global datasets, this caused in some cases to get flood maps with incomprehensible results. Hopefully in the next phases we can implement local databases to get proper results.
Projections from the CLIMAAX toolbox highlight the flood risks and the potential damage zones in Targu Secuiesc. In this workflow we will visualize risks to build infrastructure presented by river flooding. Risk is expressed in this workflow in the form of economic damages. We used pre-processed river flood maps and combined these with land use maps, as well as information on economic vulnerability (damage curves) to quantify the order of the damages in economic terms.
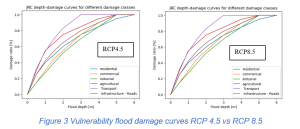
In the following the depth-damage curves for different damage classes are visualised. The plot shows the likely % of damage suffered by the different type of land regarding the depth of the water levels. We can see that in the case of RCP8.5 damage curves have a steeper rising section, which means that major damage levels are obtained even with a lover depth of floodwater, higher damage is resulted at a faster rate.
Linking land use types to economic damages
In order to assess the potential damage done by the flooding in a given scenario, we also need to assign a monetary value to the land use categories. We define this as the potential loss in €/m². The plots below show us potential economic damage to infrastructure calculated by using DamageScanner. It takes the following data:
- the clipped and resampled flood map
- the clipped land use map
- the vulnerability curves per land use category
- a table of maximum damages per land use category
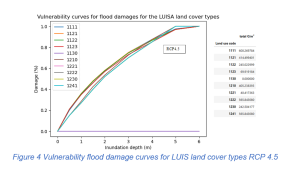
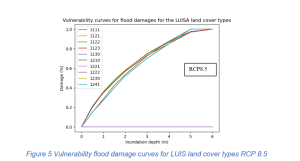
Similar to the depth-damage curves we get worse results by the RCP8.5 scenario. Residential areas are less vulnerable at lower levels of flood water, but are more vulnerable at higher levels of water than for example agricultural land. This also means that by lower water levels the damages are relatively lower than in the case of agricultural lands.
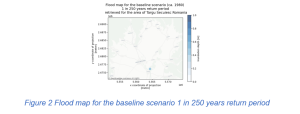
Combining the maps and curves discussed earlier we can plot the damages to get a spatial view of what places can potentially be most affected economically. As we can see in the plots below in the case of a longer return period we have a higher rate of flooded area in both examined scenarios.
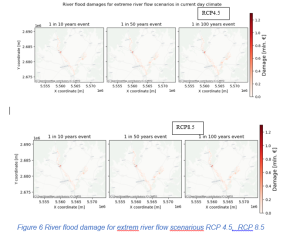
To get a better indication of why certain areas are damaged more than others, we can also plot the flood map and land use maps in one figure for a given return period.
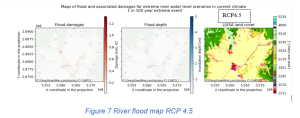
In this way we can understand and represent more easily the effects of the floods on different types of land.
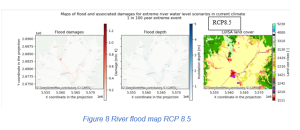
Here we see both the potential flood depths and the associated economic damages. This overview helps to see which areas carry the most economic risk under the flooding scenarios.
Preliminary Key Risk Assessment Findings River flooding
Severity
- the Europe-wide dataset of river floods provides a consistent overview of river flood hazard for all regions, but it has several important limitations, the dataset only includes large river basins (larger than 150km2) and does not include flood protections, which can lead to unrealistic flood maps in some regions;
- the result for the 250-year return period we reach the limitations of the currently available datasets, the plots generated only a blue square result;
- we observed that on the more distant periods the results become more insignificant, due to scarce data there were some lacks of results now;
- in the case of RCP8.5 damage curves have a steeper rising section, indicating major damage levels even with a lover depth of floodwater, higher damage is resulted at a faster rate;
- Like the depth-damage curves for RCP8.5 scenario, residential areas are less vulnerable at lower levels of flood water compared to agricultural lands;
- in the case of a longer return period we have a higher rate of flooded area in both examined scenarios.
Urgency
The urgency of River Flood hazard and risks heavily dependent on extreme climate events, however there is some inconsistency in the results (i.e. downscaled data is needed) they indicate negative impact on agricultural land and build environment, prioritizing the generation of more realistic flood maps is essential.
KÉZDI_Adapt Capacity Phase 1
Targu Secuiesc municipality climate risk management should be multilevel, involving policy support, financial support, education, infrastructure, and natural conservation. There were already measures taken to highlight institutional commitment in Integrated Urban Development Strategy (IUDS) 2021-2030, Sustainable Energy and Climate Action Plan (SECAP) and by accession as Signature of EU missions’ adaptation to climate change.
Different opportunities can be already identified to deal with agricultural drought and river flood risks, such as:
- Financial measures: subsidies via Common Agricultural Policy (CAP) and National Rural Development Program to support sustainable farming practices, agricultural Insurance Schemes to help farmers recover from climate-induced losses and grants for irrigation implementation and modernization to improve water use efficiency.
- Social measures: climate change education programs for farmers and rural communities, strengthening farmer cooperatives to increase resilience, meteorological and hydrological alerts for floods, droughts, and storms, local-level initiatives promoting sustainable land and water management.
- Human aspects: teaching, informing campaigns for drought-resistant crops, water-saving techniques, and precision agriculture (sensors, AI, remote sensing to optimize farming).
- Physical aspects: expansion, renovation of piers, reservoirs, and drainage systems to prevent floods, investments in smart irrigation to optimize water use.
- Natural aspects: encouraging crop rotation, organic farming, and no-till agriculture, protecting wetlands, and restoring natural floodplains.